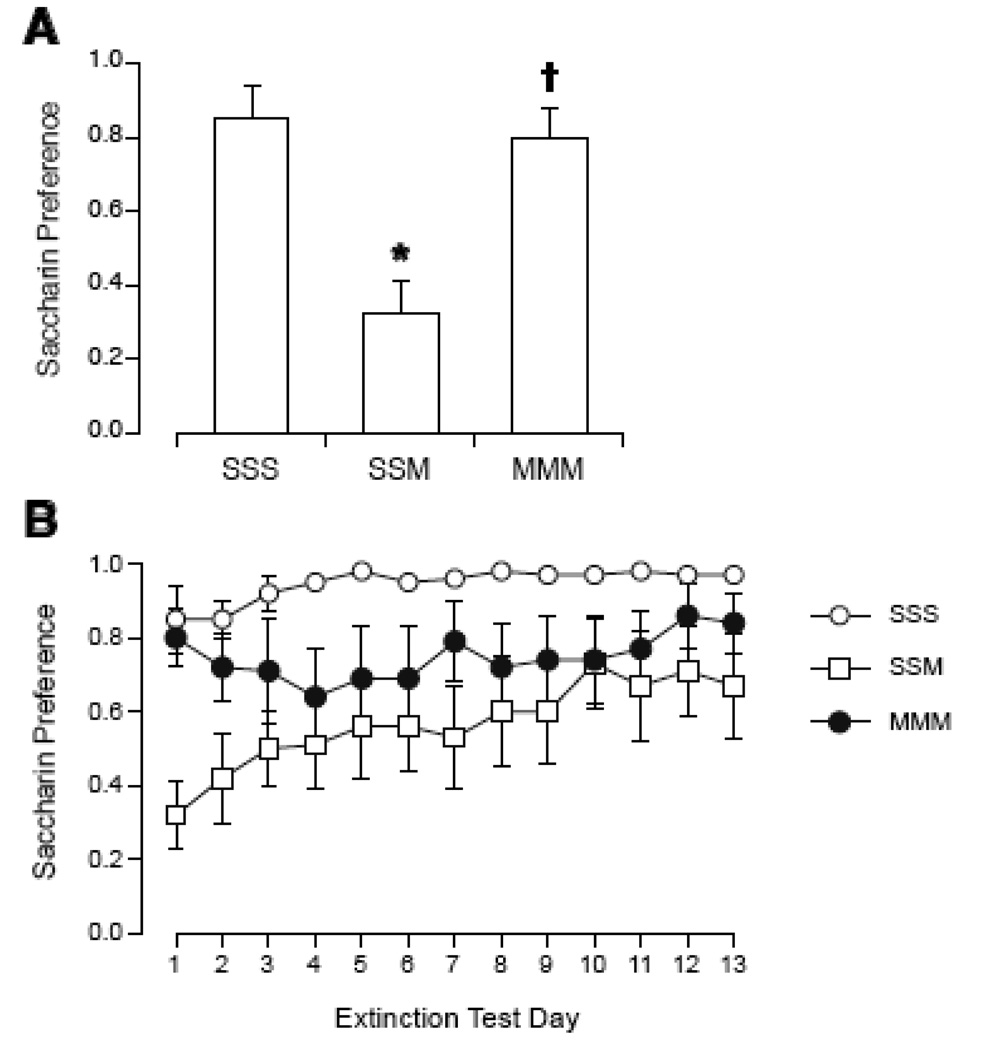
Figure 4.
Initial magnitude (A) and extinction (B) of CTA expressed as saccharin preference during 2-bottle tests in rats after repeated sham or magnet exposure on the same day. Prior to the third exposure, intake of saccharin was paired with sham exposure (group SSS) or magnet exposure (SSM and MMM). After the first 2-bottle test (A), only SSM rats showed a significant decrease in saccharin preference compared to SSS rats. Across extinction days (B), there was no significant effect of group or days. *p < 0.05 vs. SSS preference, † p < 0.05 vs. SSM preference.

