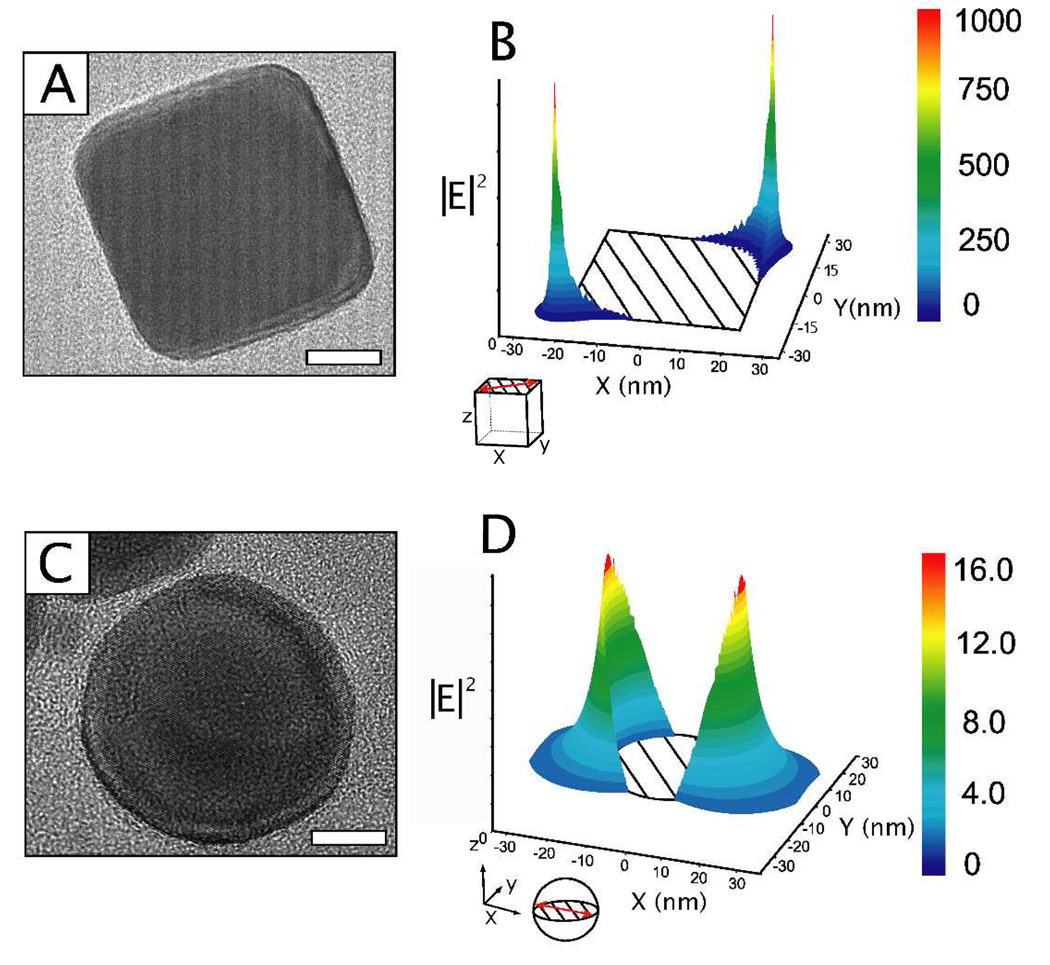
Figure 1.
Comparison of the E-field enhancement (|E|2) contours for a silver nanocube (A–B) and a silver nanosphere (C–D). The difference in particle shape can be clearly seen in the TEM images in (A) and (C). The corresponding |E|2 contour plots show the enhanced E-fields will be localized at the corners of the nanocube and are much larger compared with the nanospheres. The cartoon at the bottom of each contour plot shows the plane of the nanoparticle represented by the calculated |E|2 contour plot. For (B) the incident light is along the z-axis and the polarization (red arrow) is along the y =×direction and for; (D) the incident light along the z-axis and polarization along the x-axis. Copyright (2009) ACS.

