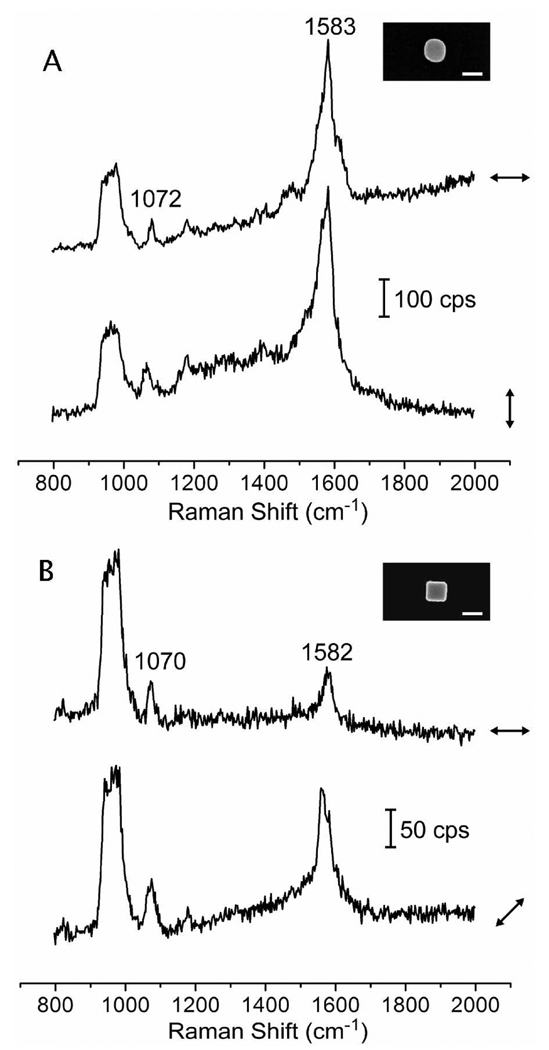
Figure 5.
SERS spectra of 4-methyl benzenethiol (4-MBT) from an individual silver nanosphere (A) and nanocube (B), respectively. Each arrow indicates the laser polarization direction relative to the nanosphere or nanocube in the SEM image. For the nanosphere, no significant variation was observed for the spectra taken at different polarization directions. For the nanocube, the SERS signals were more strongly enhanced when the laser was polarized along a face diagonal (bottom trace in B). The insets show SEM images of the probed nanosphere and nanocube. The scale bars in the insets correspond to 100 nm. Copyright (2009) Elsevier.

