
Figure 2.
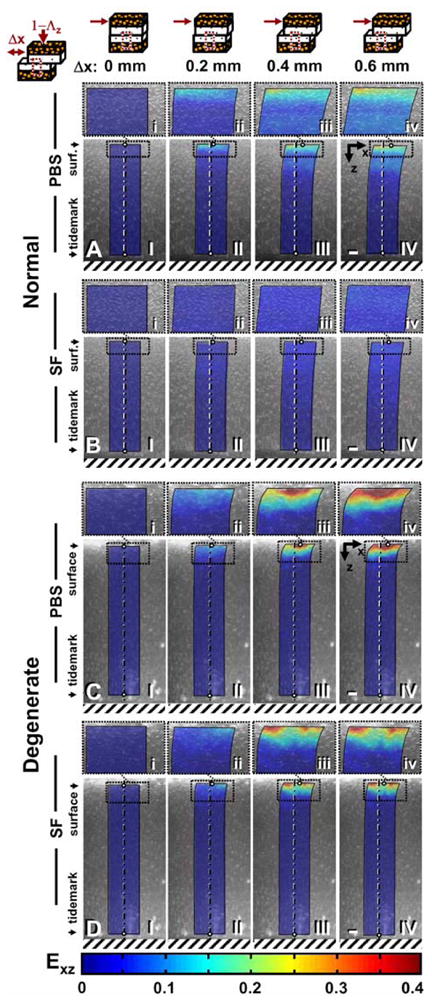
Micrographs taken during shear loading of apposing (A,B) normal and (C,D) degenerate samples lubricated with PBS (A,C) or SF (B,D) after 60 minutes of stress relaxation and (I) 0, (II) 0.2, (III) 0.4, and (IV) 0.6 mm of applied lateral displacement (Δx). Cell nuclei tracking method was used to determine (I–IV) maps of shear strain (color maps) with (i–iv) magnified views of the surface above. Bars = 150 mm.