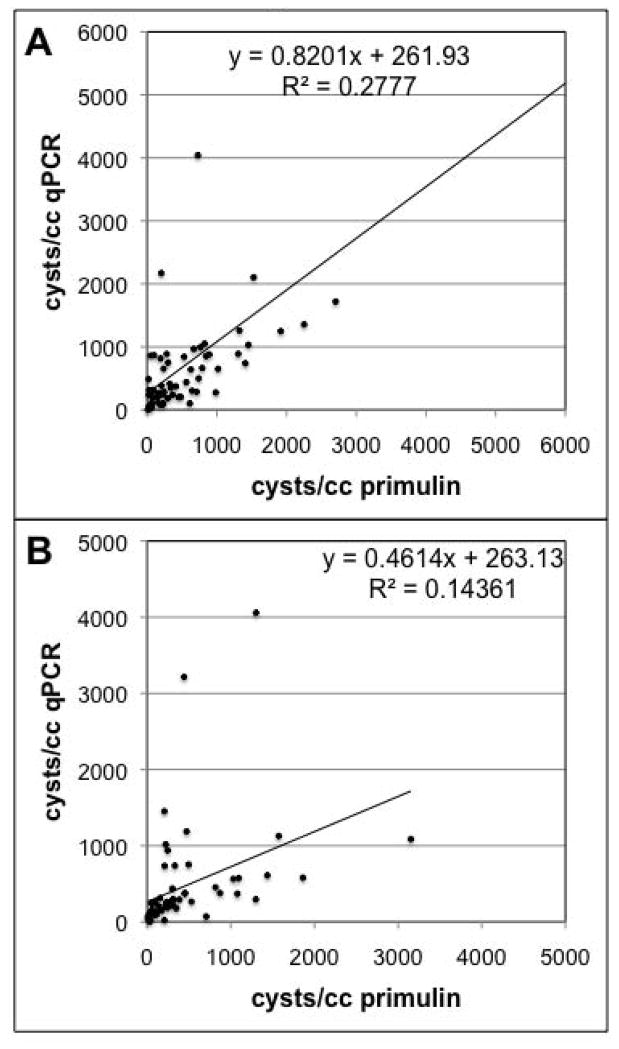
Fig. 5.
Comparison of PCR and microscope methods for samples collected at different sediment depths. The samples shown in Figure 4 are compared separately based upon the sediment depth at which the sample was collected. (A) 70 samples were analyzed from the top 1cm of sediment and (B) 59 samples were derived from the 1–3cm depth. The solid lines and equations are the best linear curve fit to the data. The cyst values calculated from the two methods are significantly correlated (p<0.005).

