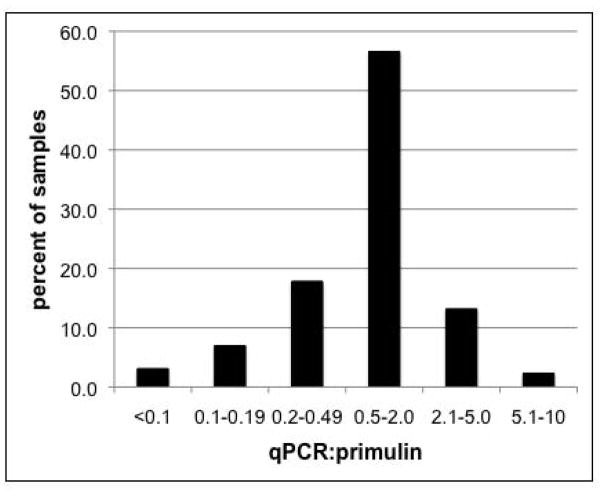
Fig. 6.
Comparison of the cyst counts obtained by the qPCR and primulin-staining/microscopy methods. The extent of variation between the methods was assessed by calculating the ratio of cysts/cc determined by primulin-staining to the cysts/cc calculated by the qPCR method. For example, a ratio of 0.5–2.0 corresponds to ≤ 2-fold difference in values between the two methods. The data are shown as the percent of total samples within the given ratio range.

