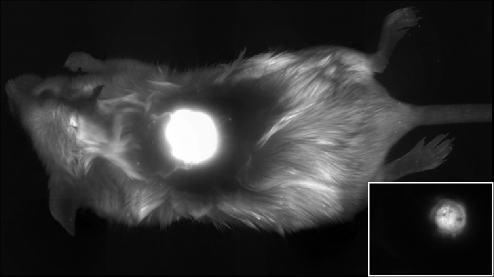
Figure 1.
Fluorescence image illustrating Pc 4 localization in an ID tumor 1 hour after IT injection at a single location. The whole mouse image was created from a series of adjacent stereofluorescence images, each with 25.2 mm x 19 mm FOVs, which were montaged after acquisition as described in Materials and Methods. Because of the intense, highly localized fluorescence at the tumor site, the display is saturated at the tumor to render the rest of the mouse visible. The inset shows the individual field containing the tumor. Here the display has been rescaled to eliminate saturation. The bright central region corresponds to the tumor.

