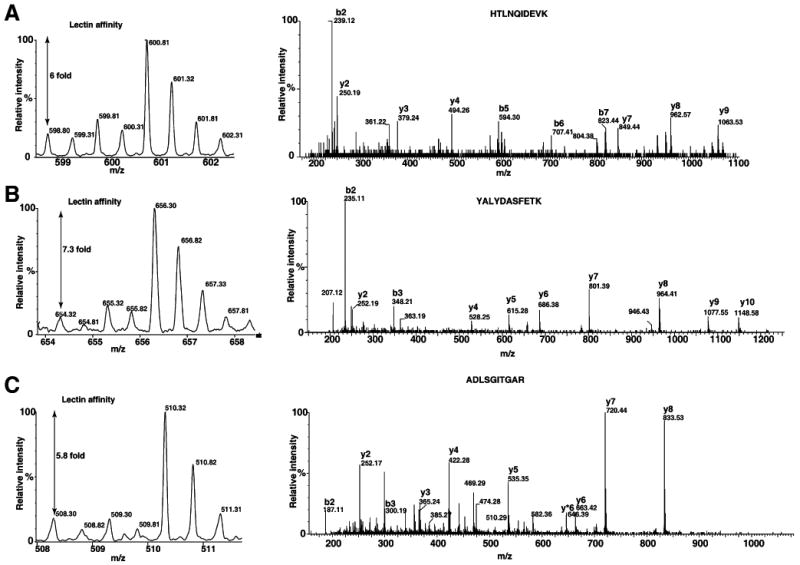
Fig. 2.

Differential proteomic analysis by 18O labeling: Proteins identified only in lectin affinity enrichment. Panel of MS spectra and MS/MS spectra showing fold changes and peptide sequence identification from overexpressed proteins in HCC. Panels A, B, and C show the MS and MS/MS spectra of HTLNQIDEVK (fetuin), YALYDAS-FETK (destrin) and ADLSGITGAR (SERPINA1), respectively. The fold changes after lectin affinity enrichment is indicated in MS spectra
