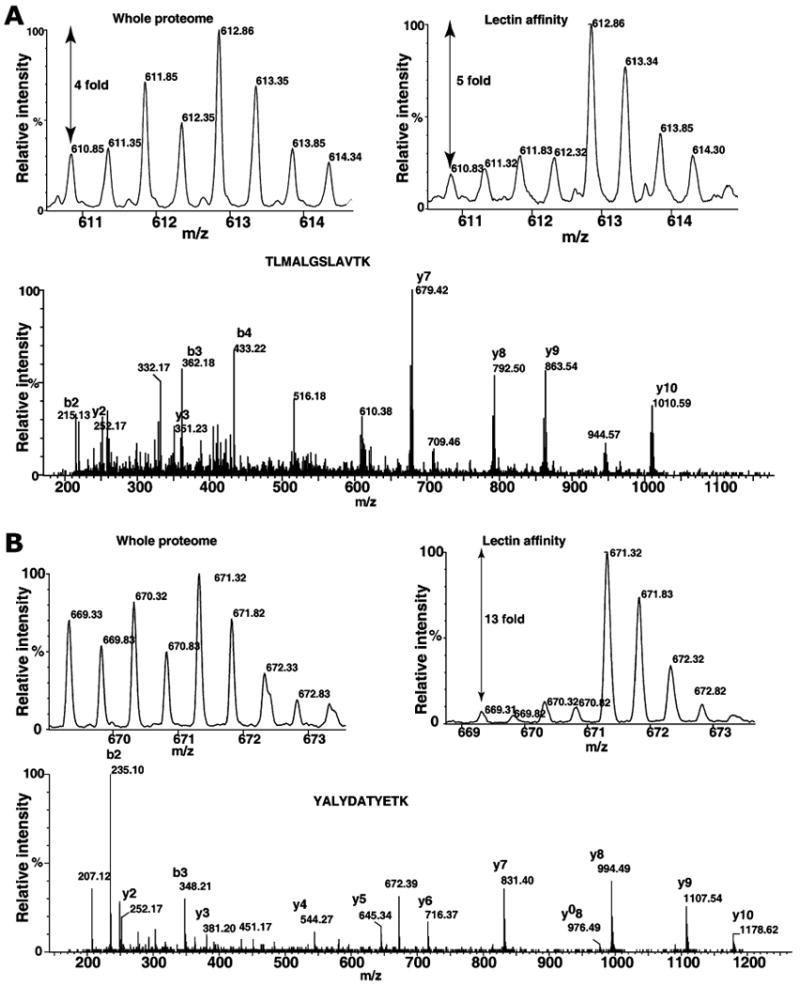
Fig. 4.

Quantitative analysis of protein changes by whole proteome and lectin enrichment analysis. Panel A and B show the MS and MS/MS spectra of TLMALGSLAVTK (transgelin) and YALYDATYETK (cofilin 1), respectively. The fold changes at the whole proteome level and after lectin affinity enrichment are indicated in MS spectra
