Figure 5.
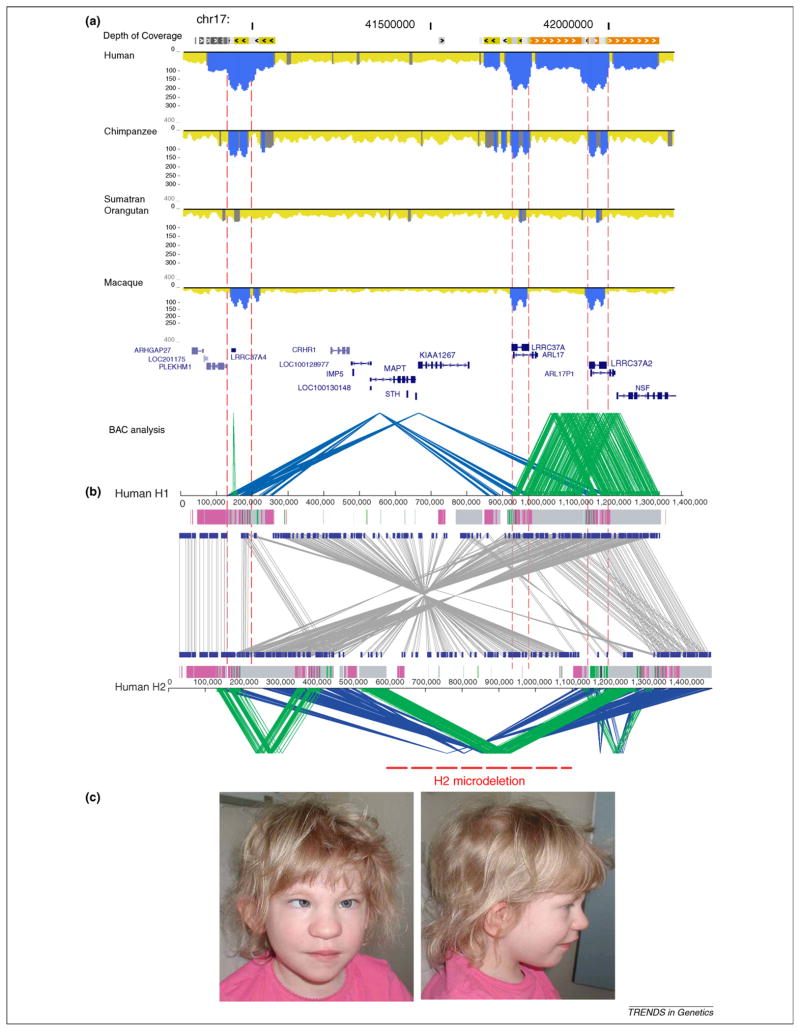
Comparative duplication architecture of 17q21.31. (a) The schematic shows the extent of duplication for a 1.5 Mb genomic region among human, chimpanzee, orangutan and macaque as determined by WSSD (blue excess read-depth). Dashed lines show the position of the “core” duplicon region corresponding to the LRRC37A gene family. The complexity of the region was not revealed until a complete high quality sequence contig was generated in BAC clones [36]. (b) The inverted sequence organization (grey lines) between two human haplotypes H1 (non-inverted) and H2 (inverted) is shown. Direct (green) and inverted (blue) SDs are depicted for both haplotypes. The H2 haplotype has larger, more identical and directly orientated duplications flanking a suite of neurological genes. It has increased in frequency in the European population presumably as a result of positive selection [85]. The different pattern of duplications in H2 leads to pathogenic microdeletions associated with the 17q21.31 deletion syndrome [17,87,89]. This region clearly highlights the complexity of the duplicated regions and the importance for high quality sequences to understand disease and human evolution. (c) A photograph of a child with cognitive disabilities and developmental delay carrying a 17q21.31 microdeletion is shown. Note the characteristic features including a bulbous nose, and silvery depigmentation of the hair and eyes.

