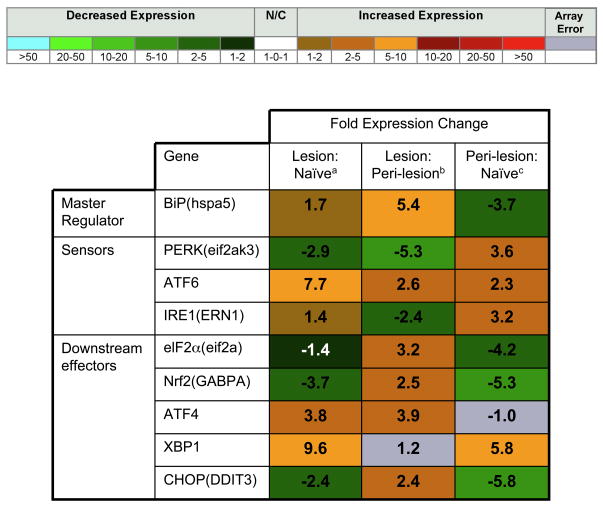
Figure 2. Expression of ERSR Proteins in EAE and Normal Tissue.
Fold expression changes in mRNA of the indicated genes (name in parentheses indicates name of gene as it appeared on the array, if it differs from the commonly used name) in spinal cord lesions from EAE mice compared to naïve spinal cord regionsa, lesions from EAE mice compared to peri-lesion regions from EAE miceb, and peri-lesion regions from EAE mice compared to naïve regionsc. Gray boxes indicate that p<0.01 among triplicate data values for a single sample, and fold change values therefore could not be reliably determined.

