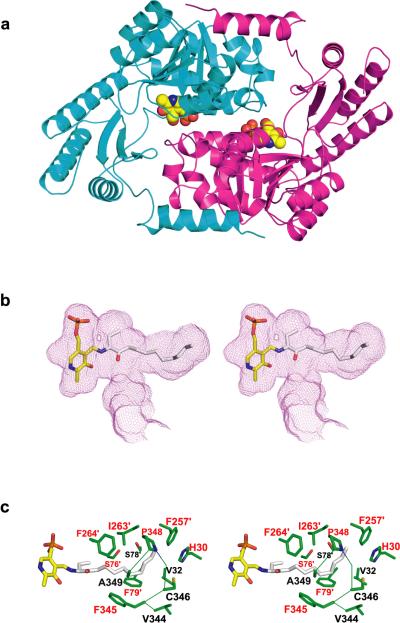
Figure 1. Structural and functional analysis of CqsA.
(a) The x-ray structure (model B; see Methods) of CqsA, with monomers depicted in cyan and magenta. The two PLP molecules are shown as space-filling models. (b) Stereo-view of the proposed PLP-amino-CAI-1 product aldimine modeled into the large cavity observed within the CqsA homodimer. The product aldimine is shown as a stick representation, with oxygen red, phosphorus orange, nitrogen blue, and carbon atoms yellow (PLP) and gray (amino-CAI-1). The cavity boundary, calculated using the program VOIDOO25, is shown as a purple mesh. (c) Stereo-view of the side chains (green) contacting the modeled product aldimine in panel (b) (except for those side chains in contact with PLP). Residue labels are color-coded according to the strength of defect caused by substitution of each residue with alanine (Table S2), with red labels for those residues whose substitution resulted in <0.05% residual autoinducer production.

