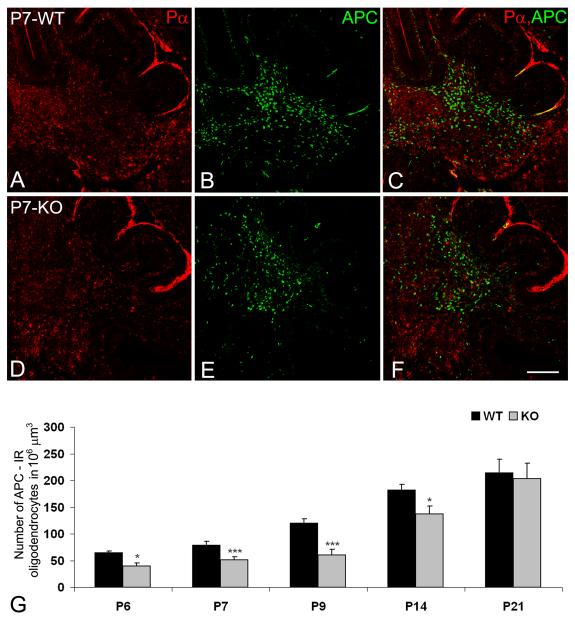
Figure 4.
The distribution of PDGFRα-immunoreactive OPCs (Pα, red) and APC-immunoreactive (green) mature oligodendrocytes in wild type (A-C) and NG2-null (D-F) cerebella at P7. The abundance of APC-positive cells (G) was determined in parasagital sections cut between the left and right superior cerebellar peduncles. Results are expressed as mean values in a standard volume (106 μm3) ± SD. Statistical significance is indicated by **p < 0.01; ***p < 0.001. Scale bar: 200 μm (A-F).

