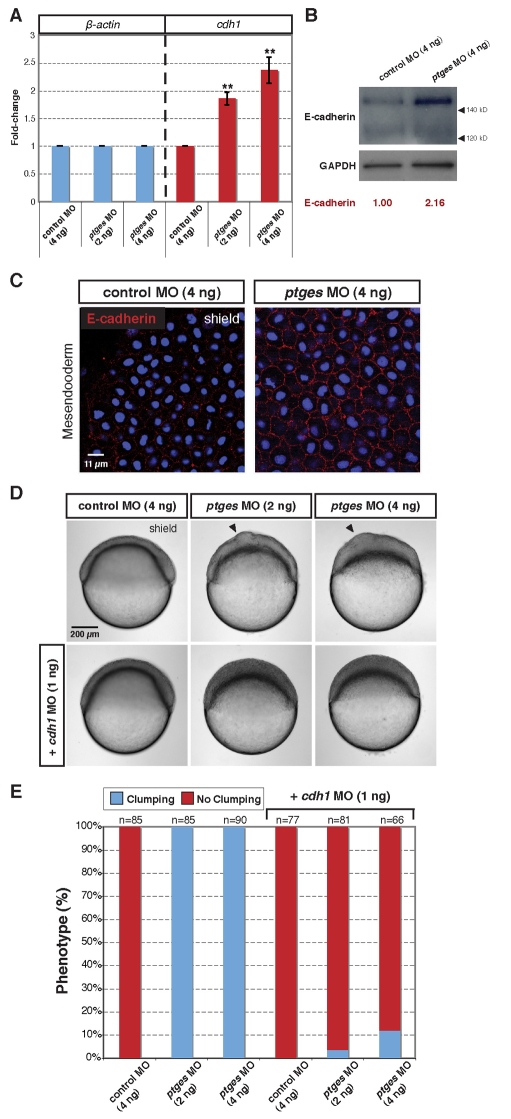
Fig. 3.
PGE2 governs cell adhesion by decreasing Cdh1 transcript and protein levels. (A) Quantitative real-time PCR (qRT-PCR) of β-actin (left) and cdh1 (right) transcript levels in control and ptges morphants at 60% epiboly. **, P<0.005. (B) Western blot of E-cadherin (top) and Gapdh (bottom, loading control) from shield-stage zebrafish embryos injected with control and ptges MOs. The two isoforms of E-cadherin present during zebrafish development have been described previously (Babb and Marrs, 2004); the larger isoform is dominant during gastrulation. (C) Confocal images of whole-mount E-cadherin immunostaining. E-cadherin protein expression (red) at the shield stage in the mesoderm (lateral view). Blue, nuclear stain. (D) Suppression of the cell clumping phenotype (arrowhead) in ptges morphants by cdh1 MO injection. Embryos are at the shield stage. (E) A compilation of two experiments in which control and ptges morphant embryos were co-injected with cdh1 MO (1 ng) and evaluated at 60% epiboly for the cell clumping phenotype.

