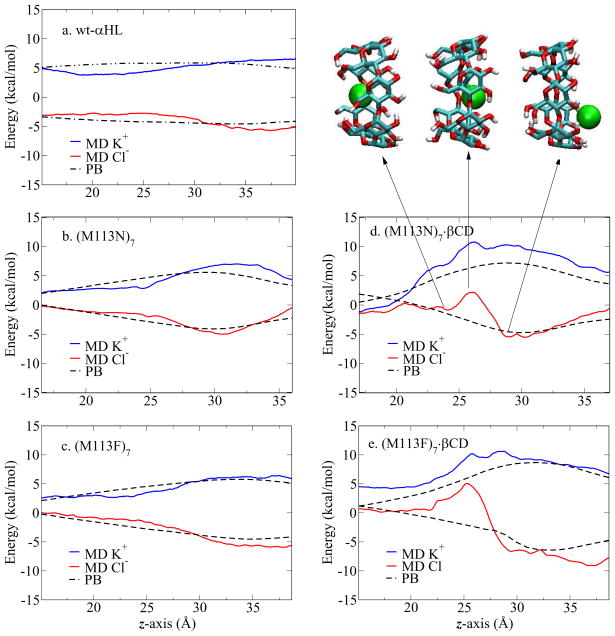
Figure 7.
1D-PMF profiles of ion passage through five channels. In PMF profiles, the red line is Cl− profile, the blue line is K+ profile and the dashed line is the electrostatic free energy profile. Three snapshots show the Cl− position corresponding to the z coordinates in the PMF profile. βCD is in licorice with atom type colors; Cl− in green ball; protein and TIP3 water molecules are not shown here.

