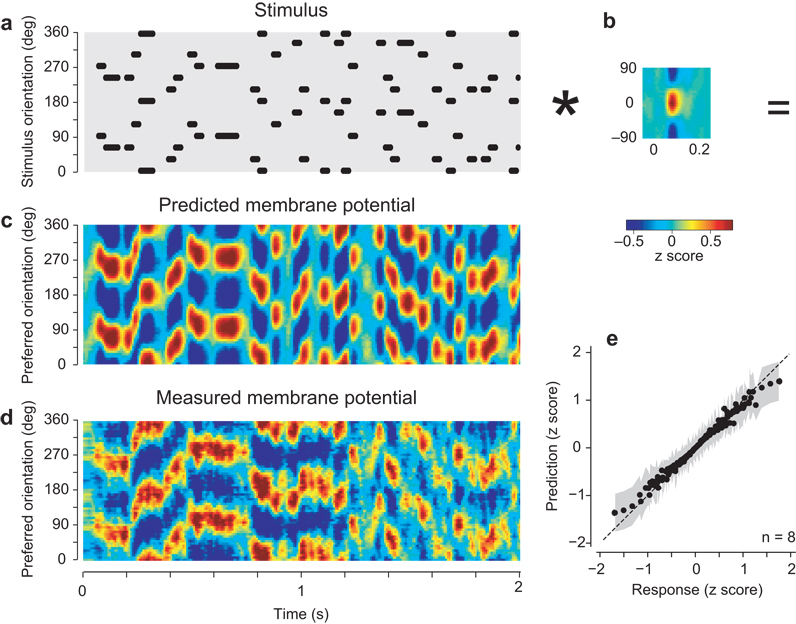
Fig. 3.
Predicting the membrane potential responses of the population to the full stimulus sequence. (a) The stimulus expressed as an image, with ones (dots) indicating the sequence of stimulus orientations as function of time, and zeros elsewhere (gray). For graphical purposes, the orientation axis was duplicated to cover the full 360° range. Thus each grating appears as two dots separated by 180°. Only 2 s of stimulation are shown here (typical stimuli lasted 30 s). Dots have been shifted in time by 74 ms to compensate for the delay of the membrane potential signal. (b) Elemental population response to a single orientation (from Fig. 2e0). The asterisk denotes convolution. (c) Population responses predicted by convolving the stimulus with the elemental response. For graphical purposes we advanced these responses in time by 58 ms to appear roughly contemporaneous with the stimulus. (d) The measured population responses, similarly shifted in time. (e) Relationship between model predictions and measured responses. Dots are mean values taken across n=8 hemispheres. Gray regions indicate ±1 s.d. Panels a–d are from experiment 56-4-1.

