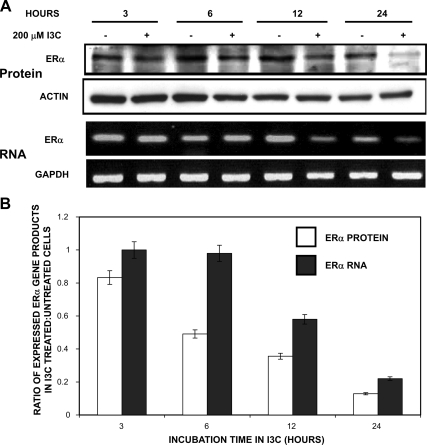
Figure 1.
Effects of I3C on kinetics of ERα expression. (A) MCF-7 human breast cancer cells were treated with or without 200 μM I3C through a 24-h time course. At the indicated time points, the levels of ERα protein were monitored by Western blots and the levels of ERα transcripts determined by RT-PCR. Actin was used as protein loading control, and GAPDH was used as a RNA loading control. PCR products were visualized on a 1% agarose gel stained with ethidium bromide. (B) Levels of ERα protein and transcripts were quantified by densitometry of the Western blots and RT-PCR gels shown in A. This result was repeated three times, and a representative blot is shown. The bar graphs represent the ratio of ERα gene expression observed in I3C-treated versus untreated controls.

