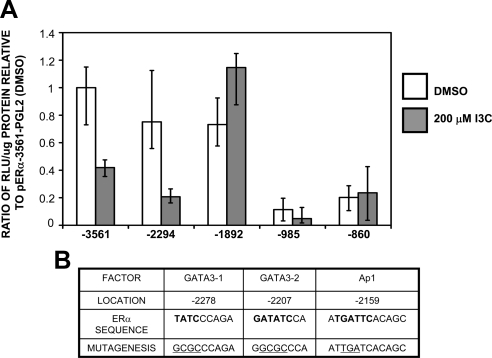
Figure 9.
Identification of the I3C responsive region of the ERα promoter and predicted transcription factor binding sites located within. (A) MCF-7 cells were transfected with the indicated ERα promoter 5′ deletion constructs linked to a luciferase reporter gene, and 24 h posttransfection cells were treated for 24 h with either the DMSO vehicle control or with 200 μM I3C. Relative luciferase activity was evaluated in lysed cells using the Luciferase assay kit (Promega) and normalized to the reporter plasmid activity of the −3561 ERα promoter fragment in cells treated with DMSO. Two controls (data not shown) included CMV-luciferase to validate transfection efficiency (positive control) and pgl2 to measure background fluorescence (negative control). Bar graphs indicate relative luciferase activity normalized to the protein input and error bars were derived from the results of three independent experiments. (B) Transcription factor binding site analysis of the I3C-responsive region was performed using TFSearch program, followed by manual curation of potential sites. Positions displayed are relative to the ERα promoter-A transcription start site. Bold bases indicate consensus sequences of the indicated transcription factor sites within the ERα promoter. Underlined sequence indicates the positions of site-directed mutagenesis and the mutations that were introduced into the ERα promoter.

