Figure 1.
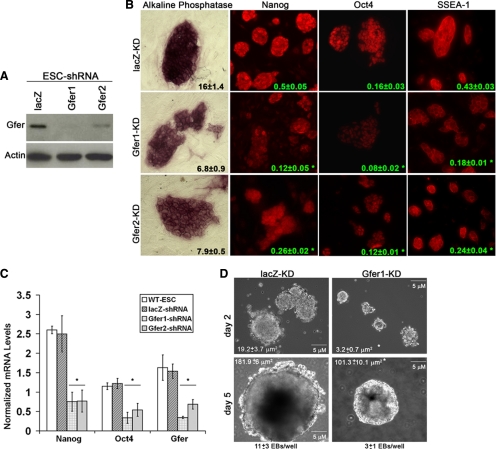
A role for Gfer in the maintenance of ESC pluripotency. (A) Representative immunoblots depicting protein levels of Gfer and Actin in Lac-Z, Gfer1, and Gfer2 KD ESCs (n = 3). (B) Digital optical section ApoTome images (magnification, 200×) of day 6 lacZ, Gfer1, and Gfer2 KD ESCs depicting alkaline phosphatase activity and levels of Nanog, Oct-4, and SSEA1 (all in red). Numbers in black and green represent average signal intensities ± SD quantified from at least 30 colonies (n = 3), *p = 0.001. (C) Average mRNA levels of Nanog, Oct-4, and Gfer in day 6 WT, WT-lacZ-KD, Gfer1-KD, and Gfer2-KD ESCs. The mRNA levels measured by qRT-PCR were normalized to actin mRNA (n = 3), *p = 0.01. (D) Embryoid bodies formed by WT-lacZ-KD and Gfer1-KD ESCs cultured in the absence of feeder cells and LIF in the media for 2 or 5 d. Magnification, ×100; scale bar, 5 μm. Average surface area in μm2 ± SD and average numbers of day 5 EBs per well ± SD from each genotype are shown (n = 3); *p = 0.005.

