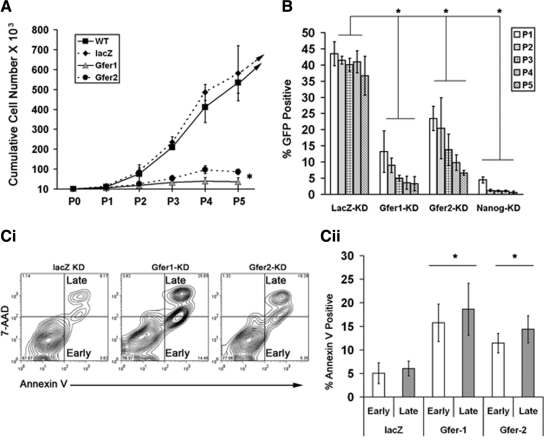
Figure 2.
Down-regulation of Gfer diminishes proliferation and cell survival in WT ESCs. (A) Average cumulative cell yield from n = 3, when WT-lacZ-KD, Gfer1-KD, and Gfer2-KD ESCs were cultured for seven passages (data from five passages are shown); *p = 0.001. (B) Self-renewal by lacZ, Gfer1, Gfer2, and Nanog KD ESCs, initially mixed (P0) at 3:1 ratio with WT ESCs, measured as percentage (%) of GFP-positive cells at all five passages by flow cytometry. Average percentage of GFP-positive ESCs from three experiments is shown; *p = 0.003. (C) Representative histogram (i) and graphs (ii) showing average (n = 4) percentage of apoptotic cells, measured by annexin V/7-AAD reactivity in WT-lacZ-KD, Gfer1-KD, and Gfer2-KD ESCs, at 72 h after cell sorting for lenti-GFP virus expression. Error bars, SD; *p = 0.0002.

