Figure 3.
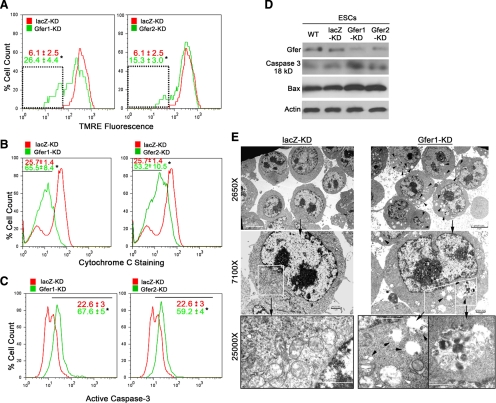
KD of Gfer initiates mitochondrial dysfunction triggering mitophagy in ESCs. (A) Representative histograms depicting TMRE fluorescence (PE channel) in lacZ and Gfer1/2 KD ESCs. Numbers in red (lacZ-KD) and green (Gfer1/2-KD) are average (n = 3) percentage (%) of cells with TMRE fluorescence intensities within the gated region (dotted box) ± SD; *p = 0.0001. Mitochondrial membrane depolarization was assessed by loss of TMRE retention/fluorescence. (B) Histographic representation of the assay measuring the release of cytochrome c in the indicated ESC genotypes. Red (lacZ-KD) and green (Gfer1/2-KD) numbers are average (n = 3) percentage of cells within the gated region (black line) ± SD; *p = 0.001, measuring loss of PE-conjugated anti-cytochrome c antibody staining. (C) Percentage of cells showing positive staining (gated with a black line) for a PE-conjugated active caspase-3 antibody. Results represent average (n = 3) percentage of cells showing positive staining in the PE channel ± SD, *p = 0.01, for lacZ (red) and Gfer1/2-KD (green). (D) Representative immunoblot (n = 3) analyses of active caspase-3 and Bax in indicated ESC genotype. Gfer and actin levels are also shown. (E) Digital TEM images depicting ultrastructural details in lacZ (left) and Gfer-1 KD (right) ESCs. Scale bars, 5 μm at ×2650 and 1 μm at ×7100 and ×25,000 magnifications. Black arrowheads, representative autophagosomes; white arrowheads, degenerating mitochondria.

