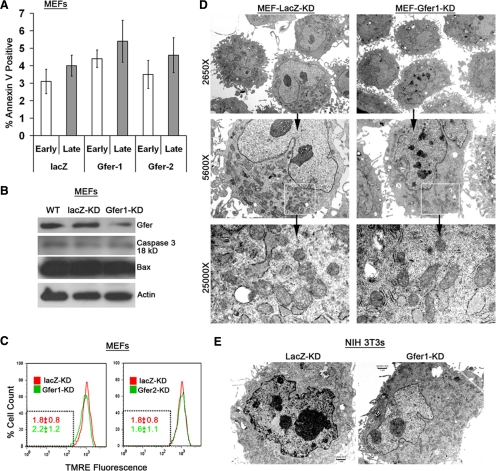
Figure 4.
Gfer KD does not affect cell viability or mitochondria in differentiated cells. (A) Graphs showing average (n = 3) percentage of apoptotic cells, measured by annexin V/7-AAD reactivity in indicated MEF genotypes, at 72 h after lentivirus infection. Error bars, SD; *p < 0.05. (B) Immunoblots (n = 2) showing Gfer, caspase 3 (18 kDa), Bax, and actin levels in indicated MEFs. (C) Representative histograms depicting TMRE fluorescence (PE channel) in LacZ and Gfer1/2 KD MEFs. Numbers in red (LacZ-KD) and green (Gfer1/2-KD) are the average (n = 3) percentage of cells with TMRE fluorescence intensities within the gated region (dotted box) ± SD; *p < 0.05. (D) Digital TEM images depicting ultrastructural details in LacZ (left) and Gfer-1 KD (right) MEFs. Magnifications, ×2650, ×5600, and ×25,000. (E) Digital TEM images depicting ultrastructural details at ×5600 magnification in LacZ (left) and Gfer-1 KD (right) NIH 3T3 cells.

