Figure 5.
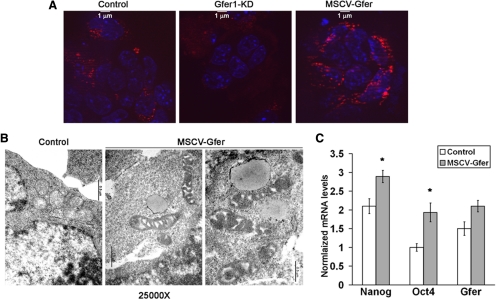
Overexpression of Gfer alters mitochondrial morphology and elevates pluripotent marker expression. (A) Representative digital ApoTome images (magnification, ×100) showing DsRed-positive mitochondria in ESCs infected with MSCV-IRES-GFP-control (control), FG12-GFP-Gfer1 shRNA, or MSCV-IRES-GFP-Gfer (MSCV-GFER) viruses. Scale bar, 1 μm; n = 3. (B) Digital TEM images at ×25,000 magnification (scale bar, 0.5 μm) depicting ultrastructural details of mitochondria in control (left) and MSCV-Gfer (both images on the right) ESCs. (C) Average mRNA levels of Nanog, Oct-4, and Gfer in day 6 control and MSCV-Gfer ESCs. The mRNA levels measured by qRT-PCR were normalized to actin; (n = 3); *p = 0.03 for Nanog and 0.006 for Oct4.

