Figure 6.
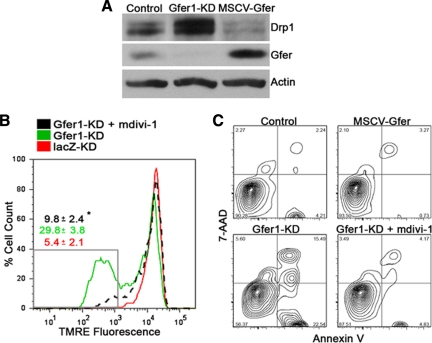
Inhibition of Drp1 rescues mitochondrial dysfunction and apoptosis in Gfer-KD ESCs. (A) Representative immunoblots (n = 3) depicting Drp1, Gfer, and actin levels in control, Gfer-KD, or MSCV-Gfer ESCs. (B) TMRE fluorescence in lacZ-KD ESCs (red), Gfer1-KD ESCs (green), and Gfer1-KD ESCs treated for 24 h with 25 μM mdivi-1(dotted black). Numbers in red (lacZ-KD), green (Gfer1-KD), and black (Gfer1-KD + 25 μM mdivi-1) are average percentage of cells with TMRE fluorescence intensities within the gated region (gray box) ± SD; (n = 3); *p = 0.005. (C) Representative histograms (n = 3) showing percentage of apoptotic cells, in control or MSCV-Gfer ESCs (top panel) and in Gfer-KD ESCs or Gfer-KD ESCs treated for 24 h with vehicle or 25 μM mdivi-1 (bottom panel).

