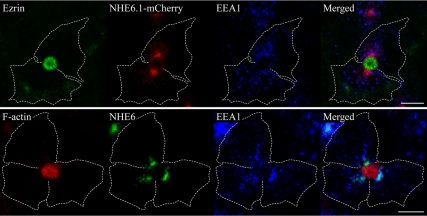
Figure 4.
Segregation of NHE6.1 from EEA1-positve early endosomes during SAC visualization. The procedure of SAC visualization described in Figure 3 was followed with NHE6.1-mCherry stable cells (top) and normal HepG2 cells (bottom), except that fluorescent lipid analogue was omitted from the solution. Cells were then fixed and investigated by immunostaining. In stable cells, the localization of NHE6.1-mCherry was identified by its fluorescence (red), and compared with the localization of Ezrin (green) and EEA1 (blue). Normal HepG2 cells were stained for F-anctin (red), NHE6 (green) and EEA1 (blue). The shape of cells was confirmed by differential interference contrast images and indicated with broken lines. Bar, 10 μm.

