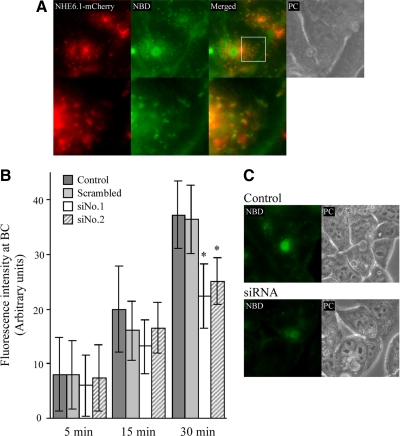
Figure 6.
Colocalization of NHE6.1 with transcytosing lipids and effect of NHE6.1 knockdown on the kinetics of transcytosis. (A) HepG2 cells stably expressing NHE6.1-mCherry (red) were incubated with 4 μM C6-NBD-GlcCer (green) on ice for 15 min and incubated at 37°C for 15 min. The remaining basolateral pool of lipid analogue was removed on ice by a back-exchange procedure and cells were observed under live condition. Merged fluorescent images and phase contrast images are also shown (Merged and PC, respectively). Bottom, high magnification of the indicated area in top panels with a white square. (B) Knockdown of NHE6.1 was conducted as described in Figure 5. After incubation with 4 μM C6-NBD-GlcCer on ice for 15 min, cells were chased at 37°C for indicated periods (5, 15, and 30 min). Quantification of the NBD fluorescence at BC was performed as described in Materials and Methods (untreated control cells, dark gray bars; scrambled siRNA-treated cells, bright gray bars; NHE6.1 siRNA-treated cells, open bars and slashed bars). In a single experiment, in each sample, randomly selected 10 BCs were analyzed and the fluorescence intensity was averaged. Data are shown as mean ± SD of four independent experiments. *p < 0.05 in unpaired Student's t test. (C) Representative images of cells chased for 30 min were shown (untreated control cells, top; NHE6.1 siRNA-treated cells, bottom.

