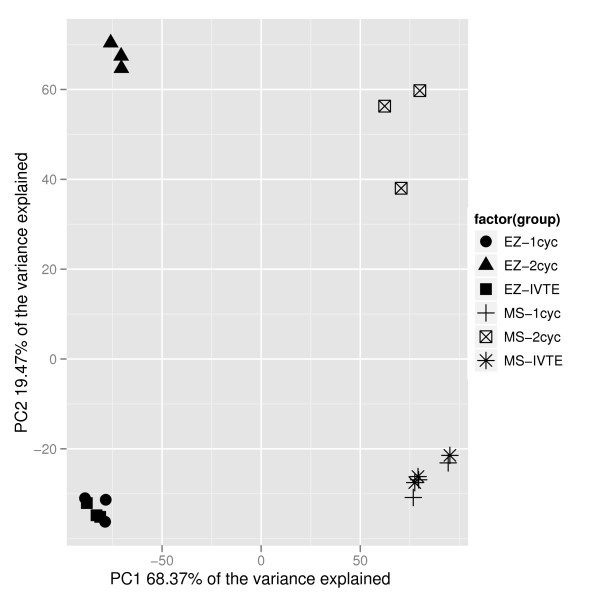
Figure 1.
Principal component analysis of the transcriptomic samples. Principal component analysis of the eighteen samples (three replicates each of MS one-cycle (MS-1cyc), MS two-cycle (MS-2cyc), MS IVT-E (MS-IVTE), EZ one-cycle (EZ-1cyc), EZ two-cycle (EZ-2cyc) and EZ IVT-E (EZ-IVTE)). Samples clustered closely together have a high level of similarity in expression levels; samples spread far apart have more divergent expression profiles. One-cycle and IVT-E samples cluster nearby each other for each tissue, whilst the two-cycle data sets are divergent.

