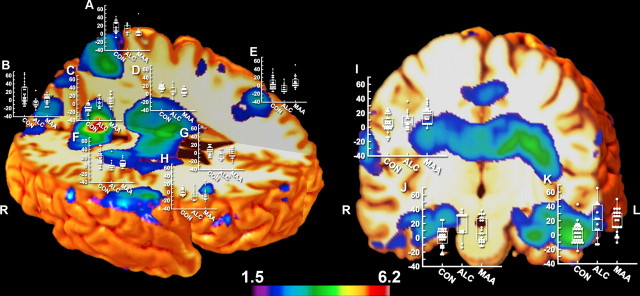
Figure 1.
Statistical F maps displaying group differences in local brain volume between CON, ALC, and MAA from the three-group analyses. Shown are surface renderings with box plots at various points over the brain where the measurements were taken. The x-axis represents the three groups (CON, ALC, and MAA), and the y-axis represents the percentage (range of −20 to 60) of tissue growth and tissue loss in the extracted anatomical points of interest from each subject relative to the MDT of 102 subjects. Shown in color are all voxels in which three-group analyses were statistically significant at a threshold of p < 0.05 (uncorrected). Anatomical location associated with each graph was as follows: A, superior parietal lobule; B, C, supracalcarine cortex; D, F, thalamus; E, midcingulate; G, H, caudate; I, posterior inferior frontal gyrus; J, K, temporal fusiform cortex. L, Left; R, right.

