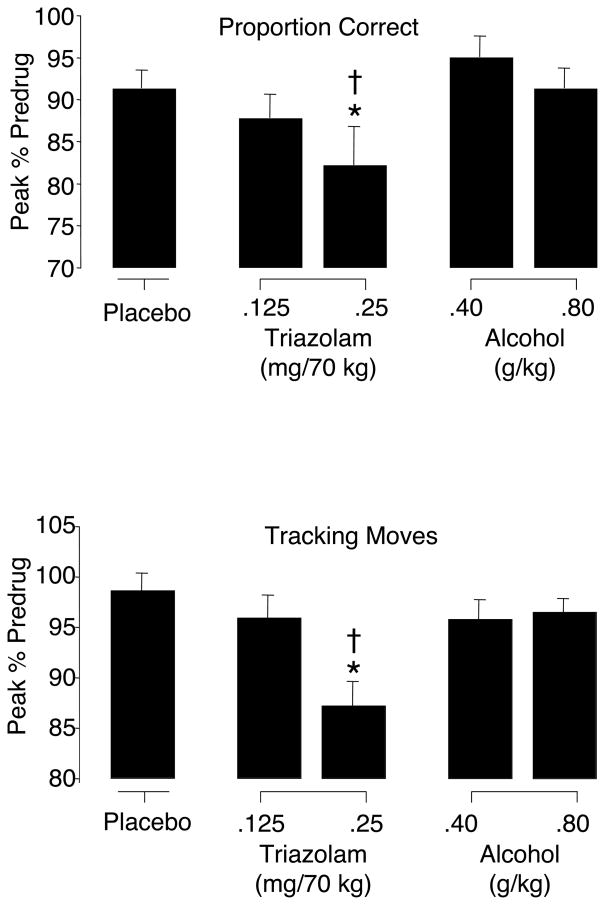
Figure 3.
Mean peak percent predrug values for proportion correct and tracking moves on the divided attention task as a function of drug condition. Brackets show 1 S.E.M. An asterisk (*) indicates an active drug value that is significantly different from placebo and a dagger (†) indicates a significant difference between triazolam and alcohol at corresponding dose levels (p ≤ 0.05).

