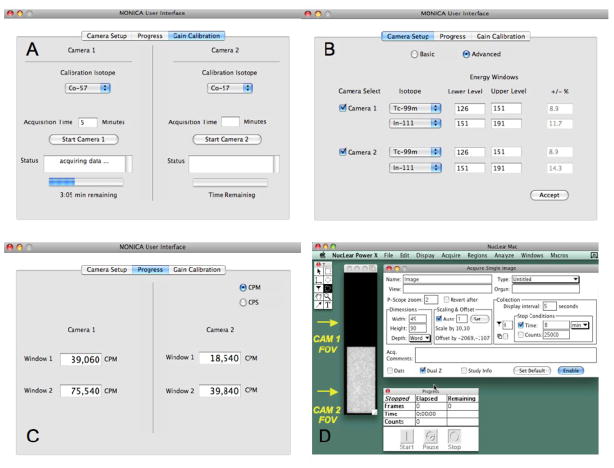
Figure 5.
(A): User interface for Gain Calibration with the onboard Co-57 field flood source. (B): Camera Setup for selection of cameras to be used in the study and their associated energy windows. (C): Progress window for monitoring count rates in each energy window during a study. (D): NucLear Mac® interface for entering data acquisition parameters, for analyzing acquired data and for viewing persistence images of the fields-of-view (FOV) of both cameras during data collection. All of these interfaces are continuously visible to the user on the Macintosh laptop computer.

