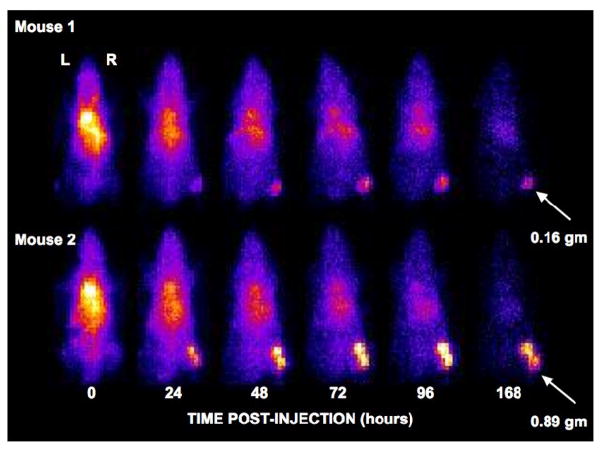
Figure 6.
Anterior projection images of the time variation of tumor (arrows) and body distribution of In-111 Panitumumab in two mice imaged with MONICA. Animals were injected with less than 3.7 MBq (100 μCi) of In-111 at time zero and were imaged in pairs (top and bottom) for 5 minutes at each time point during isoflurane inhalation. Images have been decay corrected to time zero. Mouse 1 had the smallest tumor mass and Mouse 2 the largest tumor mass of all animals studied.

