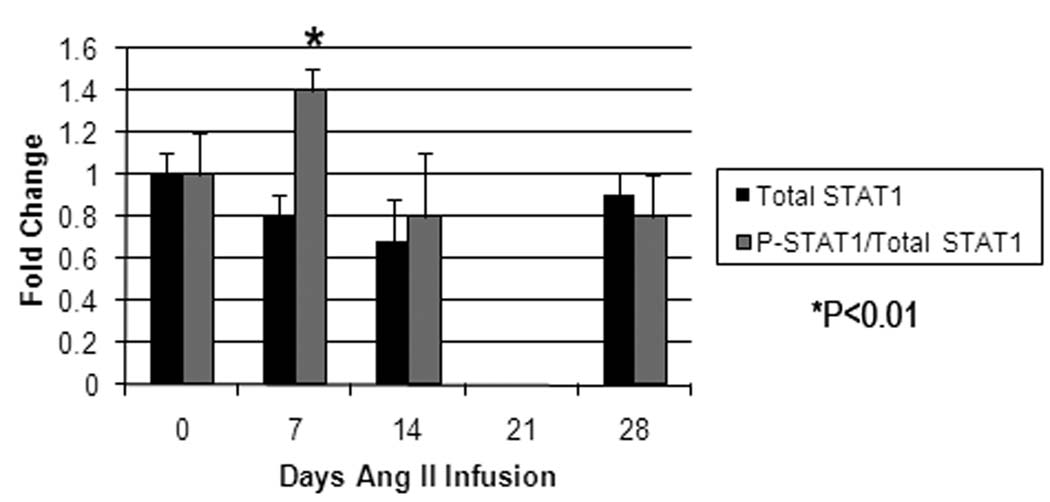
Figure 2.
Graphic presentation of temporal changes in aortic total STAT1 protein (black bars) and activated STAT1 protein (grey bars) and STAT1 mRNA from mice undergoing Ang II infusion (N=8/time point). Changes are normalized to baseline aortic levels. While there is a trend in a decrease in total STAT1 during the first two weeks of Ang II infusion, this did not reach statistical significance. There is, however, a significant increase in the fraction of STAT1 in the active form (both serine- and tyrosine-phosphorylated STAT1), peaking at 7 days of Ang II infusion (P<0.05).

