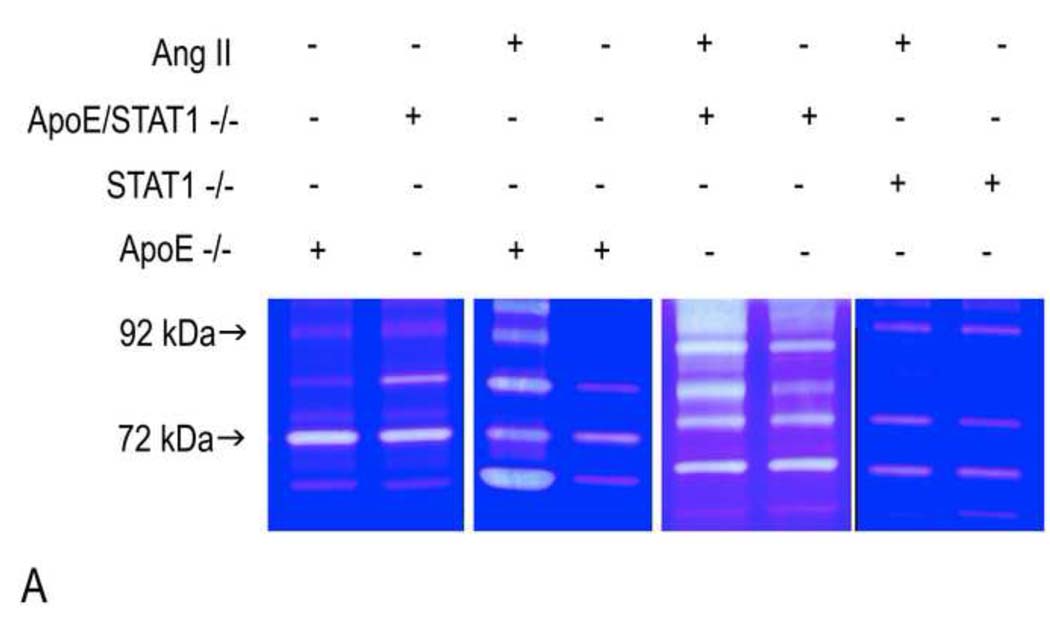
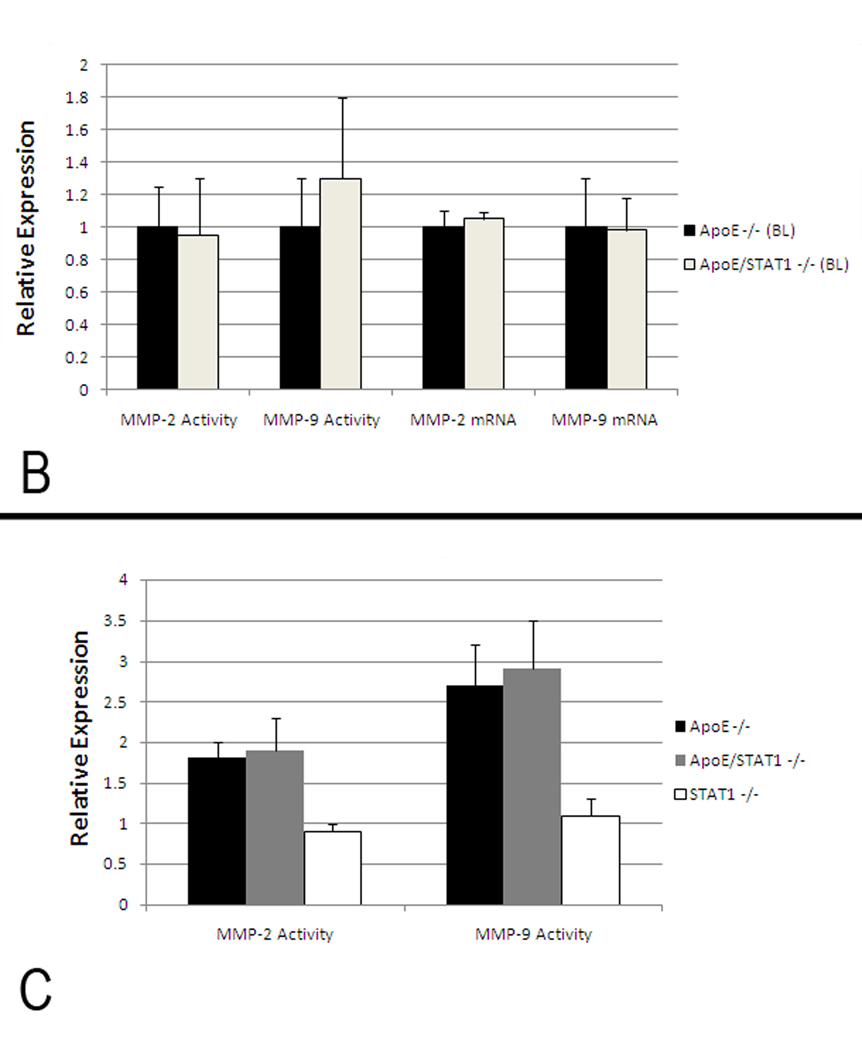
Figure 6.
(A) Representative gelatin zymograms from aortic homogenates from ApoE −/−, STAT1−/−, and ApoE/STAT1 −/− mice at baseline or following 28 days of Ang II infusion. The 92 kDa protein corresponds to pro-MMP-9 and the 72 kDa protein corresponds to pro-MMP-2. (B) Graphic representation of total MMP-2 and MMP-9 expression in ApoE −/− (black bars) and ApoE/STAT1 −/− (grey bars) mice at baseline assessed by gelatin zymography and RT-PCR (N=5 mice/strain). Results are expressed relative to expression in ApoE −/− mice. There is no significant difference in MMP activity or mRNA levels at baseline in these strains. (C) Graphic representation MMP-2 and MMP-9 activity (assessed by gelatin zymography) from aortic homogenates obtained from ApoE −/− (black bars), ApoE/STAT1−/− (gray bars), and STAT1 −/− (white bars) following 28 days of Ang II infusion (N=5 mice/strain). Results are expressed normalized to corresponding strains at baseline.


