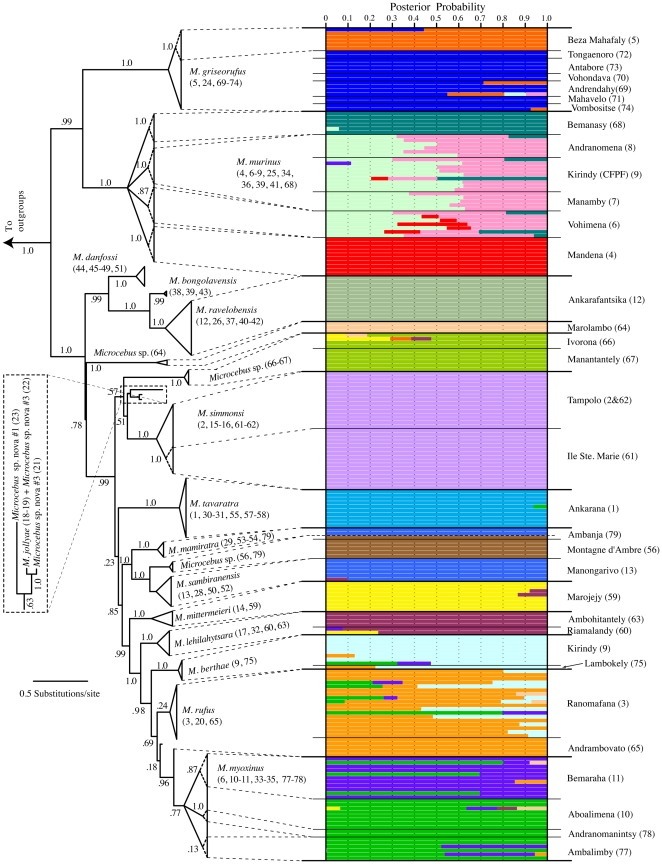
Figure 2. Correspondence between clades in the mtDNA gene tree and nuclear Structure clusters.
The mtDNA gene tree results from Bayesian analysis of concatenated cox2 and cytb sequence. It is presented as a maximum credibility topology with branch lengths averaged across the posterior distribution. Numbers on branches represent posterior probabilities. Relationships within terminal clades are collapsed for ease of presentation and clades are labeled according to present species designations. Locality numbers are given in parentheses and correspond to Fig. 1 and Table S1. Clades are mapped to corresponding clusters in the nuclear STRUCTURE plot. Each cluster is designated by a different color with horizontal bars representing individuals and the proportion of a bar assigned to a single color representing the posterior probability that an individual is assigned to that cluster. This can also be interpreted as the percentage of an individuals genome that is derived from that particular genetic cluster. Localities from which individuals are sampled from are given along the right side of the plot. MtDNA clades not mapped to the assignment plot represent individuals for which corresponding nDNA data is not available. The colors in the Bayesian assignment plot do not correspond to colored areas of micro-endemism in Fig. 1.

