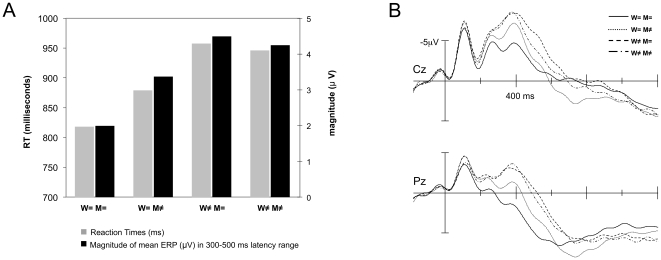
Figure 4. Word by Melody interaction.
(A) For each of the 4 experimental conditions (averaged across both tasks because there was no Task x Word x Melody interaction): the reaction time in milliseconds (gray bars, left Y-axis) and the magnitude (µV) of the mean amplitude of the ERPs in the 300–500 ms latency range, averaged across all electrodes (black bars, right Y-axis). (B) ERPs associated with the 4 experimental conditions (averaged across both tasks because there was no Task x Word x Melody interaction) for electrodes Cz (top) and Pz (bottom). Solid line: same word, same melody; dotted line: same word, different melody; dashed line: different word, same melody; dashed-dotted line: different word, different melody.

