
Fig. 1.
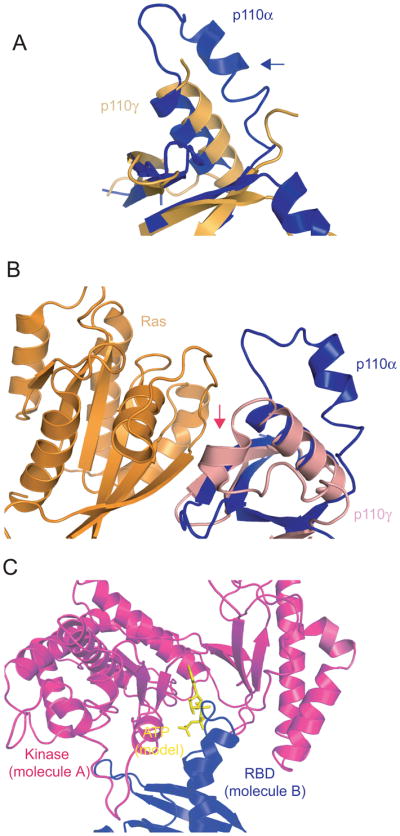
Comparison of the RBDs (Ras-binding domains) of p110α and p110γ
A. Comparison of the RBDs of p110α (blue) and free p110γ (gold). The blue arrow shows the ordering of residues 227–247 in p110α.
B. Comparison of the RBDs of p110α and Ras/p110γ complex. The red arrow indicates the position of residues 255–267 in p110γ that become ordered by the binding of Ras.
C. Interaction between p110α molecules in the crystal structure. The RBD (blue, molecule B) is locked in the ATP binding pocket of the kinase domain from a neighboring molecule (magenta, molecule A)