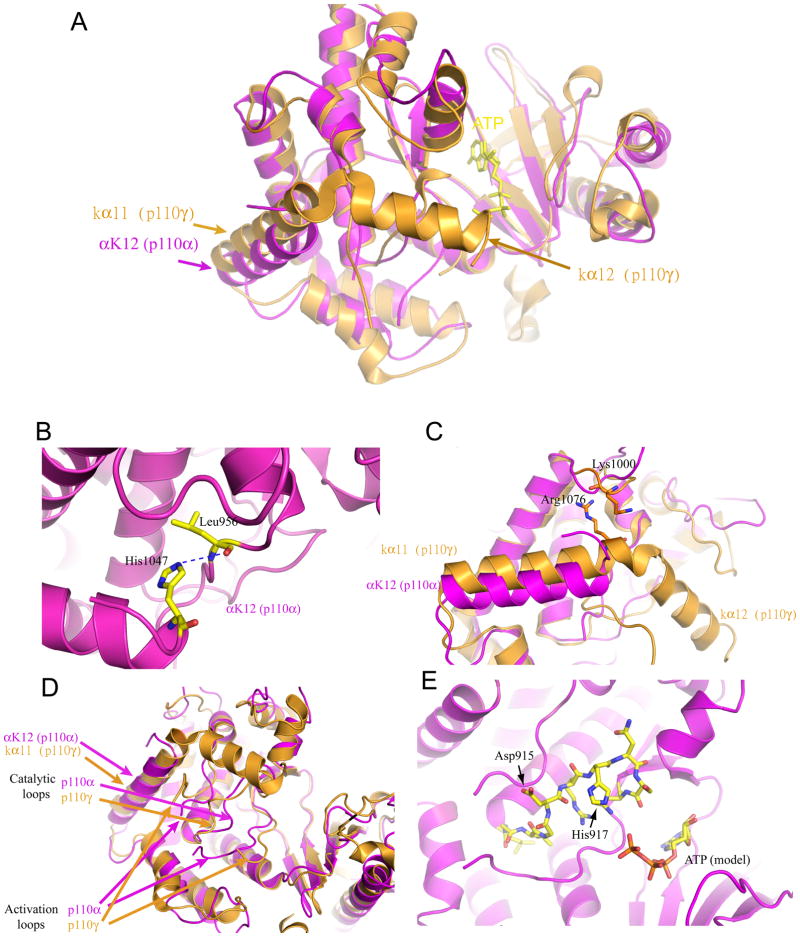
Fig. 3.
Comparison between the Kinase domains of p110α and p110γ
A. The two equivalent helices, αK12 of p110α and kα11 of p110γ, are shown in magenta and orange, respectively. The positions of the helices in each of the structures are shown by the arrows.
B. The interaction between His1047 and Leu956 in p110α is shown.
C. The interaction between Arg1076 and Lys1000 in p110γ is shown. Superposition of the p110α shows the different position of αK12 helix compared with kα11 helix of p110γ.
D. Conformations of the activation and catalytic loops of p110α and p110γ.

