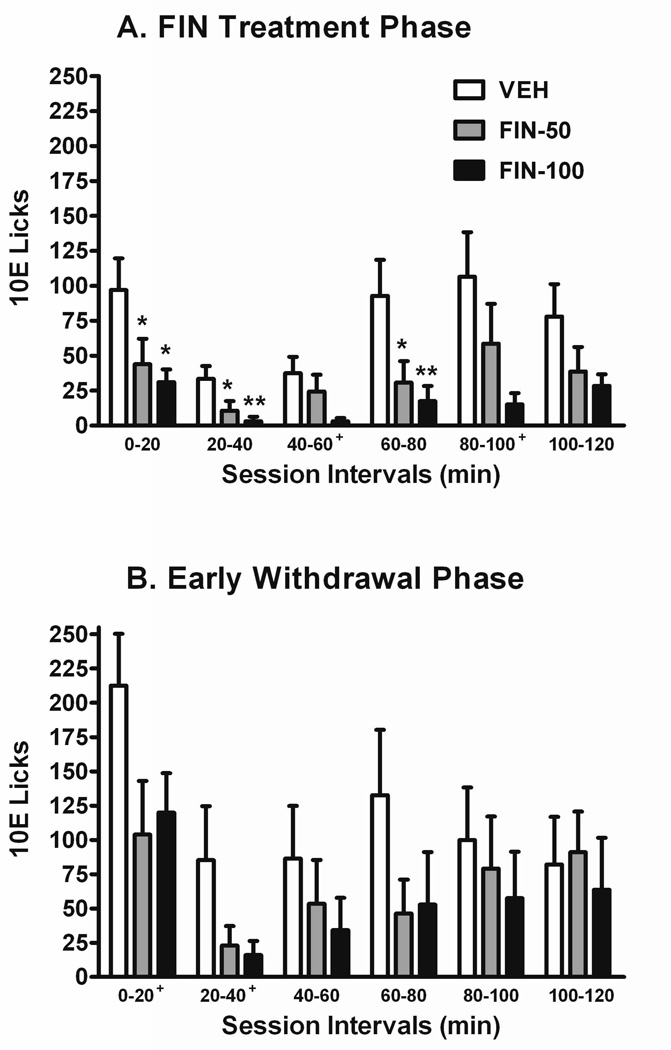
Fig. 2. Effects of FIN treatment and its withdrawal on the temporal distribution of 10E licks during acquisition.
The absolute lick values recorded throughout the 2-hr drinking session are depicted in 20-min bins. Treatment phase (i.e., 7-day) averages of lick distributions during FIN treatment (panel A) and its subsequent early withdrawal (sessions W1-W7; panel B) are shown. Vertical bars represent the mean ± SEM licks for the VEH (n = 7), FIN-50 (n = 8), and FIN-100 (n = 8) groups. *P ≤ 0.05 and **P ≤ 0.01 versus VEH-treated mice within respective session interval. +P ≤ 0.10 denotes a trend towards a significant effect of FIN dose within the designated session intervals.

