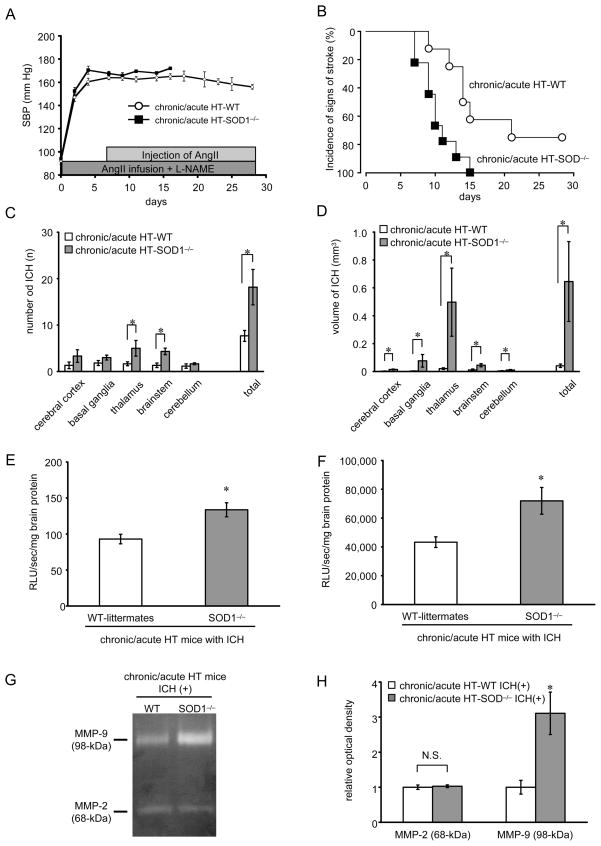
Figure 5.
(A) Basal systolic blood pressure (SBP) in chronic/acute HT group; SOD1−/− mice (chronic/acute HT-SOD−/−, n=9) and WT-littermates (chronic/acute HT-WT, n=8). (B) Kaplan-Meier plot of incidence of signs of stroke. (C) Number and (D) volume of ICH per mouse in SOD1−/− mice (n=9) and in WT-littermates (n=6). *p<0.05. (E) Basal level of superoxide and (F) NAD(P)H oxidase activity in brain homogenates of chronic/acute HT group with ICH in SOD1−/− mice and in WT-littermates. (G) Gelatin zymography showing gelatinolytic activity of MMP-2 (68-kDa: latent form) and MMP-9 (98-kDa: latent form). (H) Relative optical density of MMP-2 (68-kDa) and MMP-9 (98-kDa) in chronic/acute HT group with ICH; SOD1−/− mice [chronic/acute HT-SOD−/− ICH(+), n=6] and WT-littermates [chronic/acute HT-WT ICH(+), n=6]. *p<0.05 vs chronic/acute HT-WT mice with ICH.

