Figure 6.
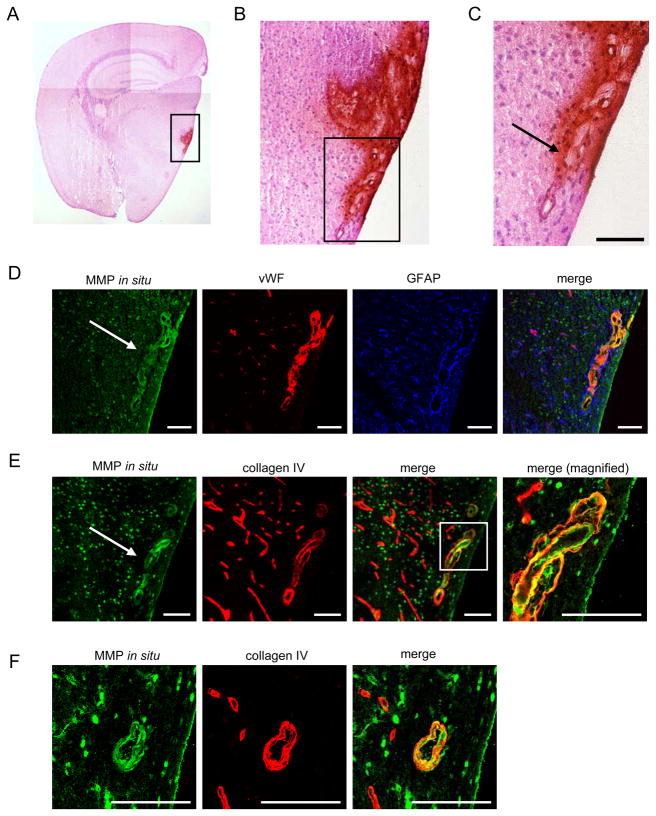
ICH in thalamus of SOD1−/− mouse in chronic/acute HT group. (A–C) DAB staining followed by H&E staining showing ICH lesion in thalamus. Boxes in panels (A) and (B) were magnified in panels (B) and (C), respectively. Arrow indicates a cerebral vessel that appeared to lead toward a region with ICH. (D–F) In situ zymography combined with immunohistochemistry on cerebral vessel in thalamus. Box in panel (E merge) was magnified in the panel at far right (merge, magnified). (F) Vessel that is distant from an ICH region in the thalamus. vWF: endothelial cell. GFAP: astrocytes. Collagen type IV: extracellular matrix. Images of (C) to (E) were derived from serial sections. Bars: 100 μm.

