
Figure 1.
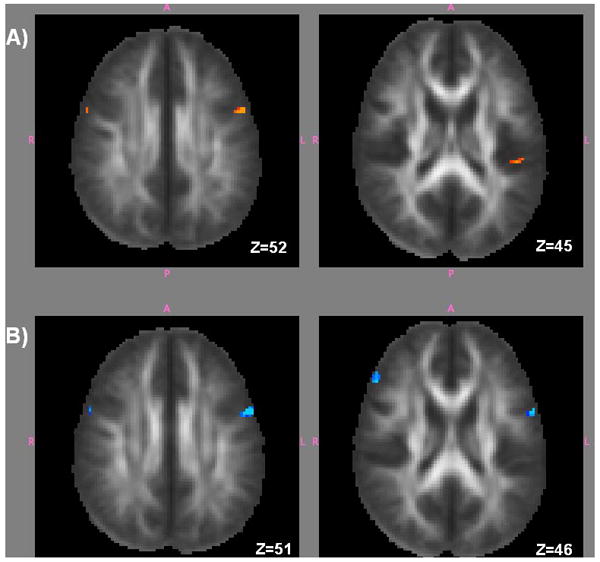
Statistical parametric maps (p<.001, cluster threshold = 5). Panel A (slices shown are z = 52 and z = 45) shows regions of decreased FA in the dyslexia group. Panel B (slices shown are z = 51 and z = 46) shows regions where FA is correlated to performance on the test of word reading (TOWRE).