
Figure 2.
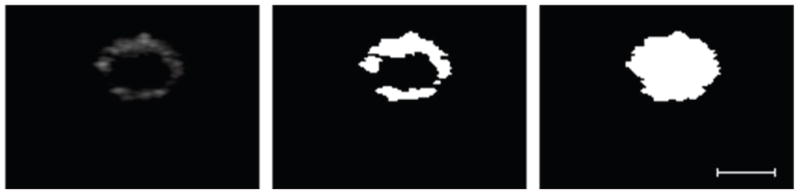
Representative isolated gray scale image of the 3A implant (A). The implant after a threshold has been applied (B). The total area image generated from the threshold image (C). The scale bar represents 0.25cm.
Official websites use .gov
A
.gov website belongs to an official
government organization in the United States.
Secure .gov websites use HTTPS
A lock (
) or https:// means you've safely
connected to the .gov website. Share sensitive
information only on official, secure websites.
Representative isolated gray scale image of the 3A implant (A). The implant after a threshold has been applied (B). The total area image generated from the threshold image (C). The scale bar represents 0.25cm.