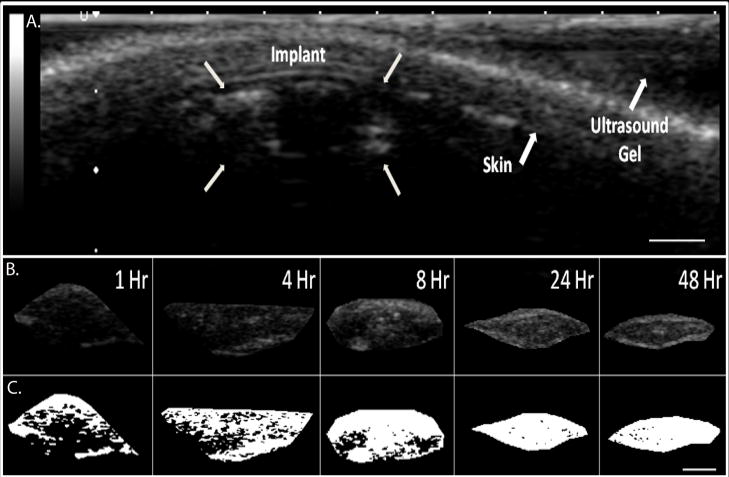
Figure 6.
A. Representative ultrasound image of subcutaneous implant after 1 hr; arrows indicate location of the implant, skin, and ultrasound gel. B. isolated gray scale images of the in vivo subcutaneous implants over time, C. threshold image of the same implant (shown in B.). Scale bar represents 0.25cm.

