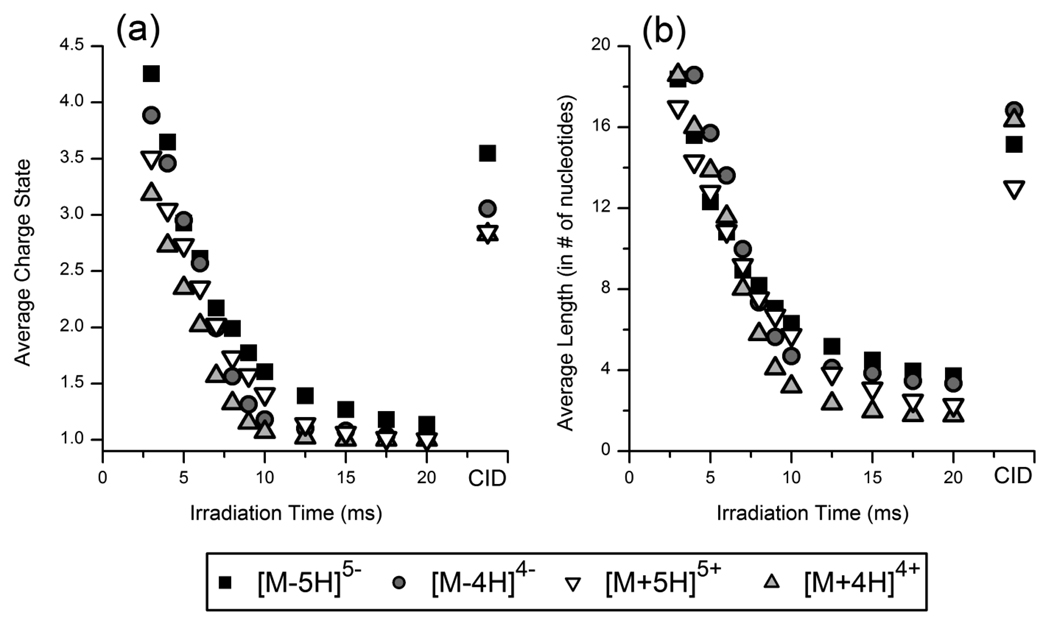
Figure 6.
(a) Average charge state (absolute value) and (b) average length (in # of nucleotides) of product ions of GAPDH.S in the 5− (squares), 5+ (upside-down triangles), 4− (circles) and 4+ (triangles) charge states as a function of irradiation time. Values from the CID mass spectra are also plotted as the right most points in each panel.

