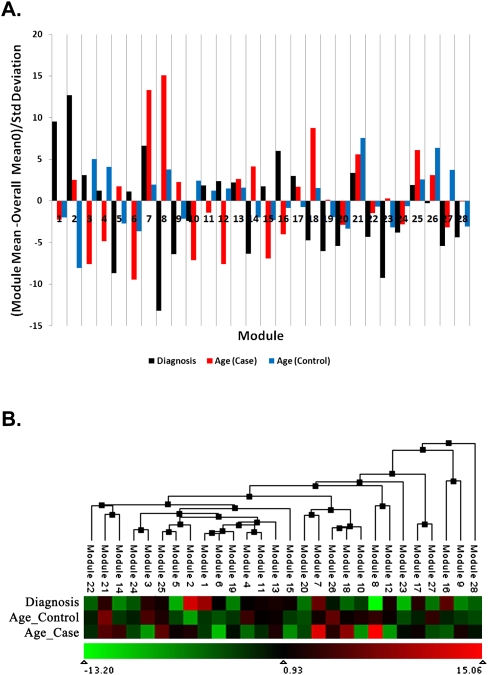
Figure 2.
(A) Module enrichment of differentially expressed and age-related genes. Enrichment of each module with differentially expressed genes in cases versus controls (black bars) and genes whose expression changes with age (red bars, schizophrenia; blue bars, controls) is depicted in terms of the number of standard deviations the Wilcoxon rank-sum score deviates from the overall average score. Positive scores correspond to a higher score than average and demonstrate an enrichment of differentially expressed or age-related genes, while negative scores correspond to a lower score than average and demonstrate a deficit of differentially expressed or age-related genes. The threshold for significance after correction for multiple tests is 2.91. (B) Eigengene clustering to display the relationships between modules. Each module is summarized by its first principal component (eigengene) and clustered on the basis of the absolute correlation between module eigengenes. The heatmap depicts module enrichment of differentially expressed and age-related genes as in A, where the color represents the number of standard deviations the Wilcoxon rank-sum score deviates from the overall average score.

