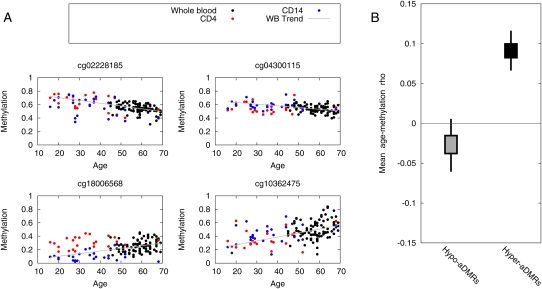
Figure 1.
Aging-associated differentially methylated regions (aDMRs) found in human whole blood. (A) Methylation values (Beta scores from the Illumina Beadstudio software) are plotted as a function of age for 93 whole-blood samples, and 25 CD14+ monocyte and CD4+ T-cell samples. The whole-blood samples were collected from separate individuals than the sorted cells, and thus provide independent cross-validation. Trend lines show a least-squares fit to the whole-blood data set. Shown are four representative examples. A complete list of aDMRs is presented in Supplemental Table 3. (B) CpGs neighboring the aDMR CpG show similar age-related DNA methylation dynamics. For each CpG in the confirmed aDMR sets, we located the nearest neighbor (in terms of genomic location) represented on the array, and calculated the mean aging/methylation correlation of the two sets of neighbor CpGs. Box-and-whisker plots represent 50% and 95% credible intervals on the mean (bootstrapped).

