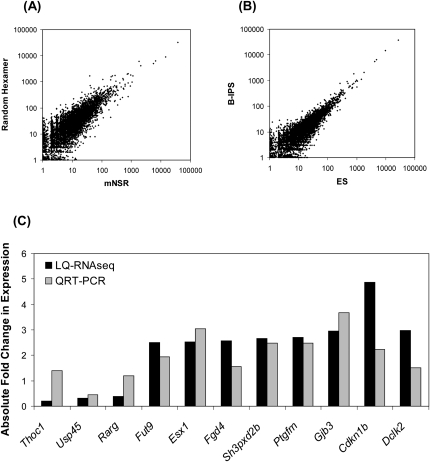
Figure 4.
Transcriptome profiling of B-iPS and ES cells. (A) Random hexamer and mNSR primer approaches using B-iPS RNA yield similar gene expression profiles. (B) Induced pluripotent stem cells derived from B lymphocytes exhibit expression profiles similar to embryonic stem cells. Log10 abundance is expressed using the number of unique reads aligned to each transcript in each sequencing experiment and is expressed as reads number per kilobase per 1 million reads. (C) Validation of differentially expressed genes identified by LQ-RNAseq with the qRT-PCR assay. (Black bars) Fold differences observed with LQ-RNAseq; (gray bars) fold differences observed with qRT-PCR. The two genes (Thoc1 and Rarg) exhibiting discrepant expression level changes may be due to the difference in the way expression levels are calculated with the two assays and the potential presence of alternative transcript isoforms.

