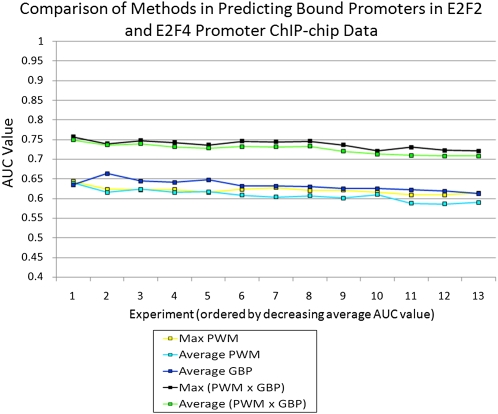
Figure 5.
Results at predicting targets for E2F2 and E2F4 using new ChIP-chip experiments. The chart shows a comparison of five methods for the task of predicting gene targets of the E2F family of transcription factors based on 13 different ChIP-chip experiments. For each method, an AUC value was computed for each of the 13 experiments. The experiments were ordered in descending order of the average AUC value across the five methods considered. The x-axis shows the position in this ordering, and the y-axis shows the AUC value corresponding to the position. The plot shows that the methods that jointly use the GBP and motif have a higher AUC value at each rank position, when compared to methods that use only the GBP or only the motif information. The experiments these correspond to can be found in Supplemental Table 9.

