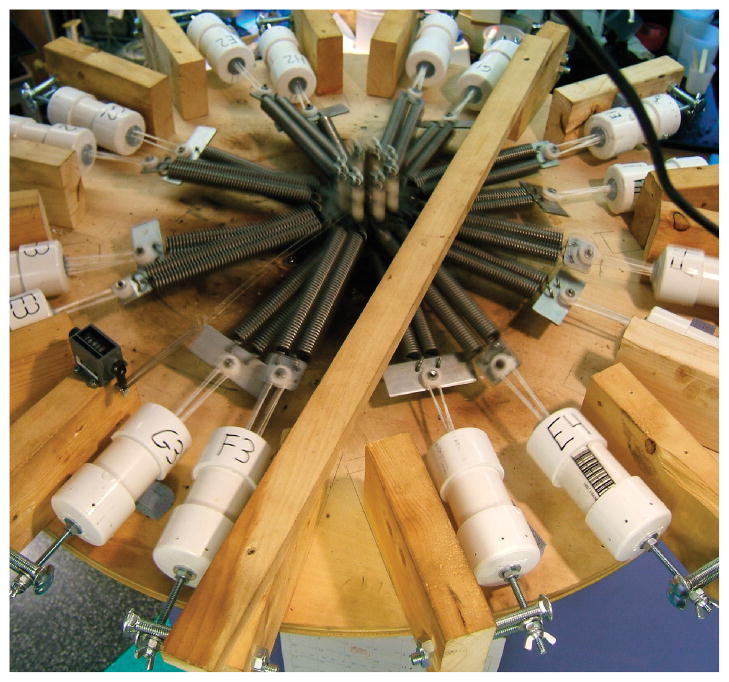
Figure 2. Fatigue Test Rig.
The device was run at 3Hz, near continually, for successive sets of samples and a cumulative elapsed time of about 6 months. Photo images recorded each minute established failure times. Continuous ‘web-cam’ images and data sampling allowed off-site monitoring on a 24-hour basis.

