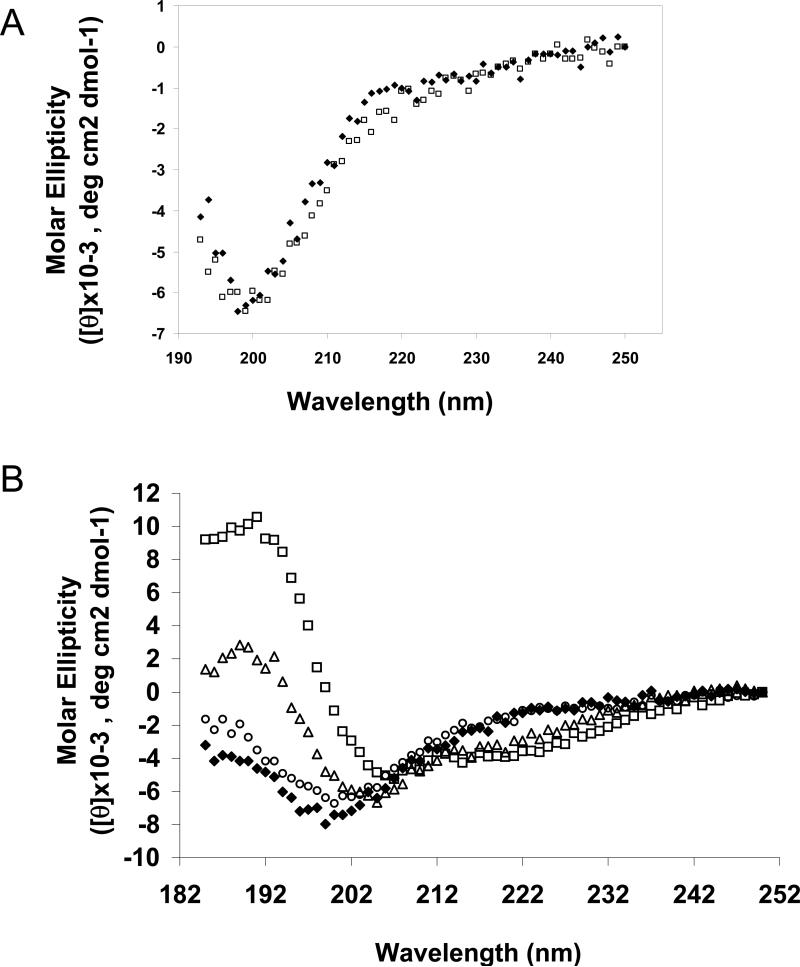
Figure 8.
CD analysis of rLOX-PP. (A) Far UV CD spectra (250-193 nm) of 8 μM LOX-PP acquired in 10 mM sodium phosphate buffer pH 7.2 (◆), or 10 mM sodium phosphate buffer pH 7.2, 100 mM sodium chloride (◇). (B) Far UV CD spectra (250-185 nm) of 4 μM LOX-PP, acquired in 10 mM sodium phosphate buffer pH 7.2 with increasing concentrations of TFE 0 % (◆), 20 % (○), 40 % (△), and 80 % (□). Each spectrum is an average of 3 individual scans at 25 °C. For each condition, baseline spectrum was recorded and subtracted from the spectrum of the protein. The y-axis depicts molar ellipticity ([θ] × 10-3 deg cm2 dmol-1) plotted against wavelength on the x-axis.

